Setting up the Grafana Dashboard
Now that you have your node up and running, you'll probably want to have a convenient way to monitor everything about it at a glance to make sure it's functioning correctly (and what kind of earnings it's generating for you).
There are many tools out there that do this job. One of the most popular is called Grafana - an easy-to-use, general-purpose dashboard system that you can access with a browser.
Rocket Pool comes out-of-the-box with support for Grafana and its dependencies; it even comes with a pre-built dashboard for each of the Consensus clients. For example, here is a snapshot of what the dashboard looks like on the Hoodi test network:
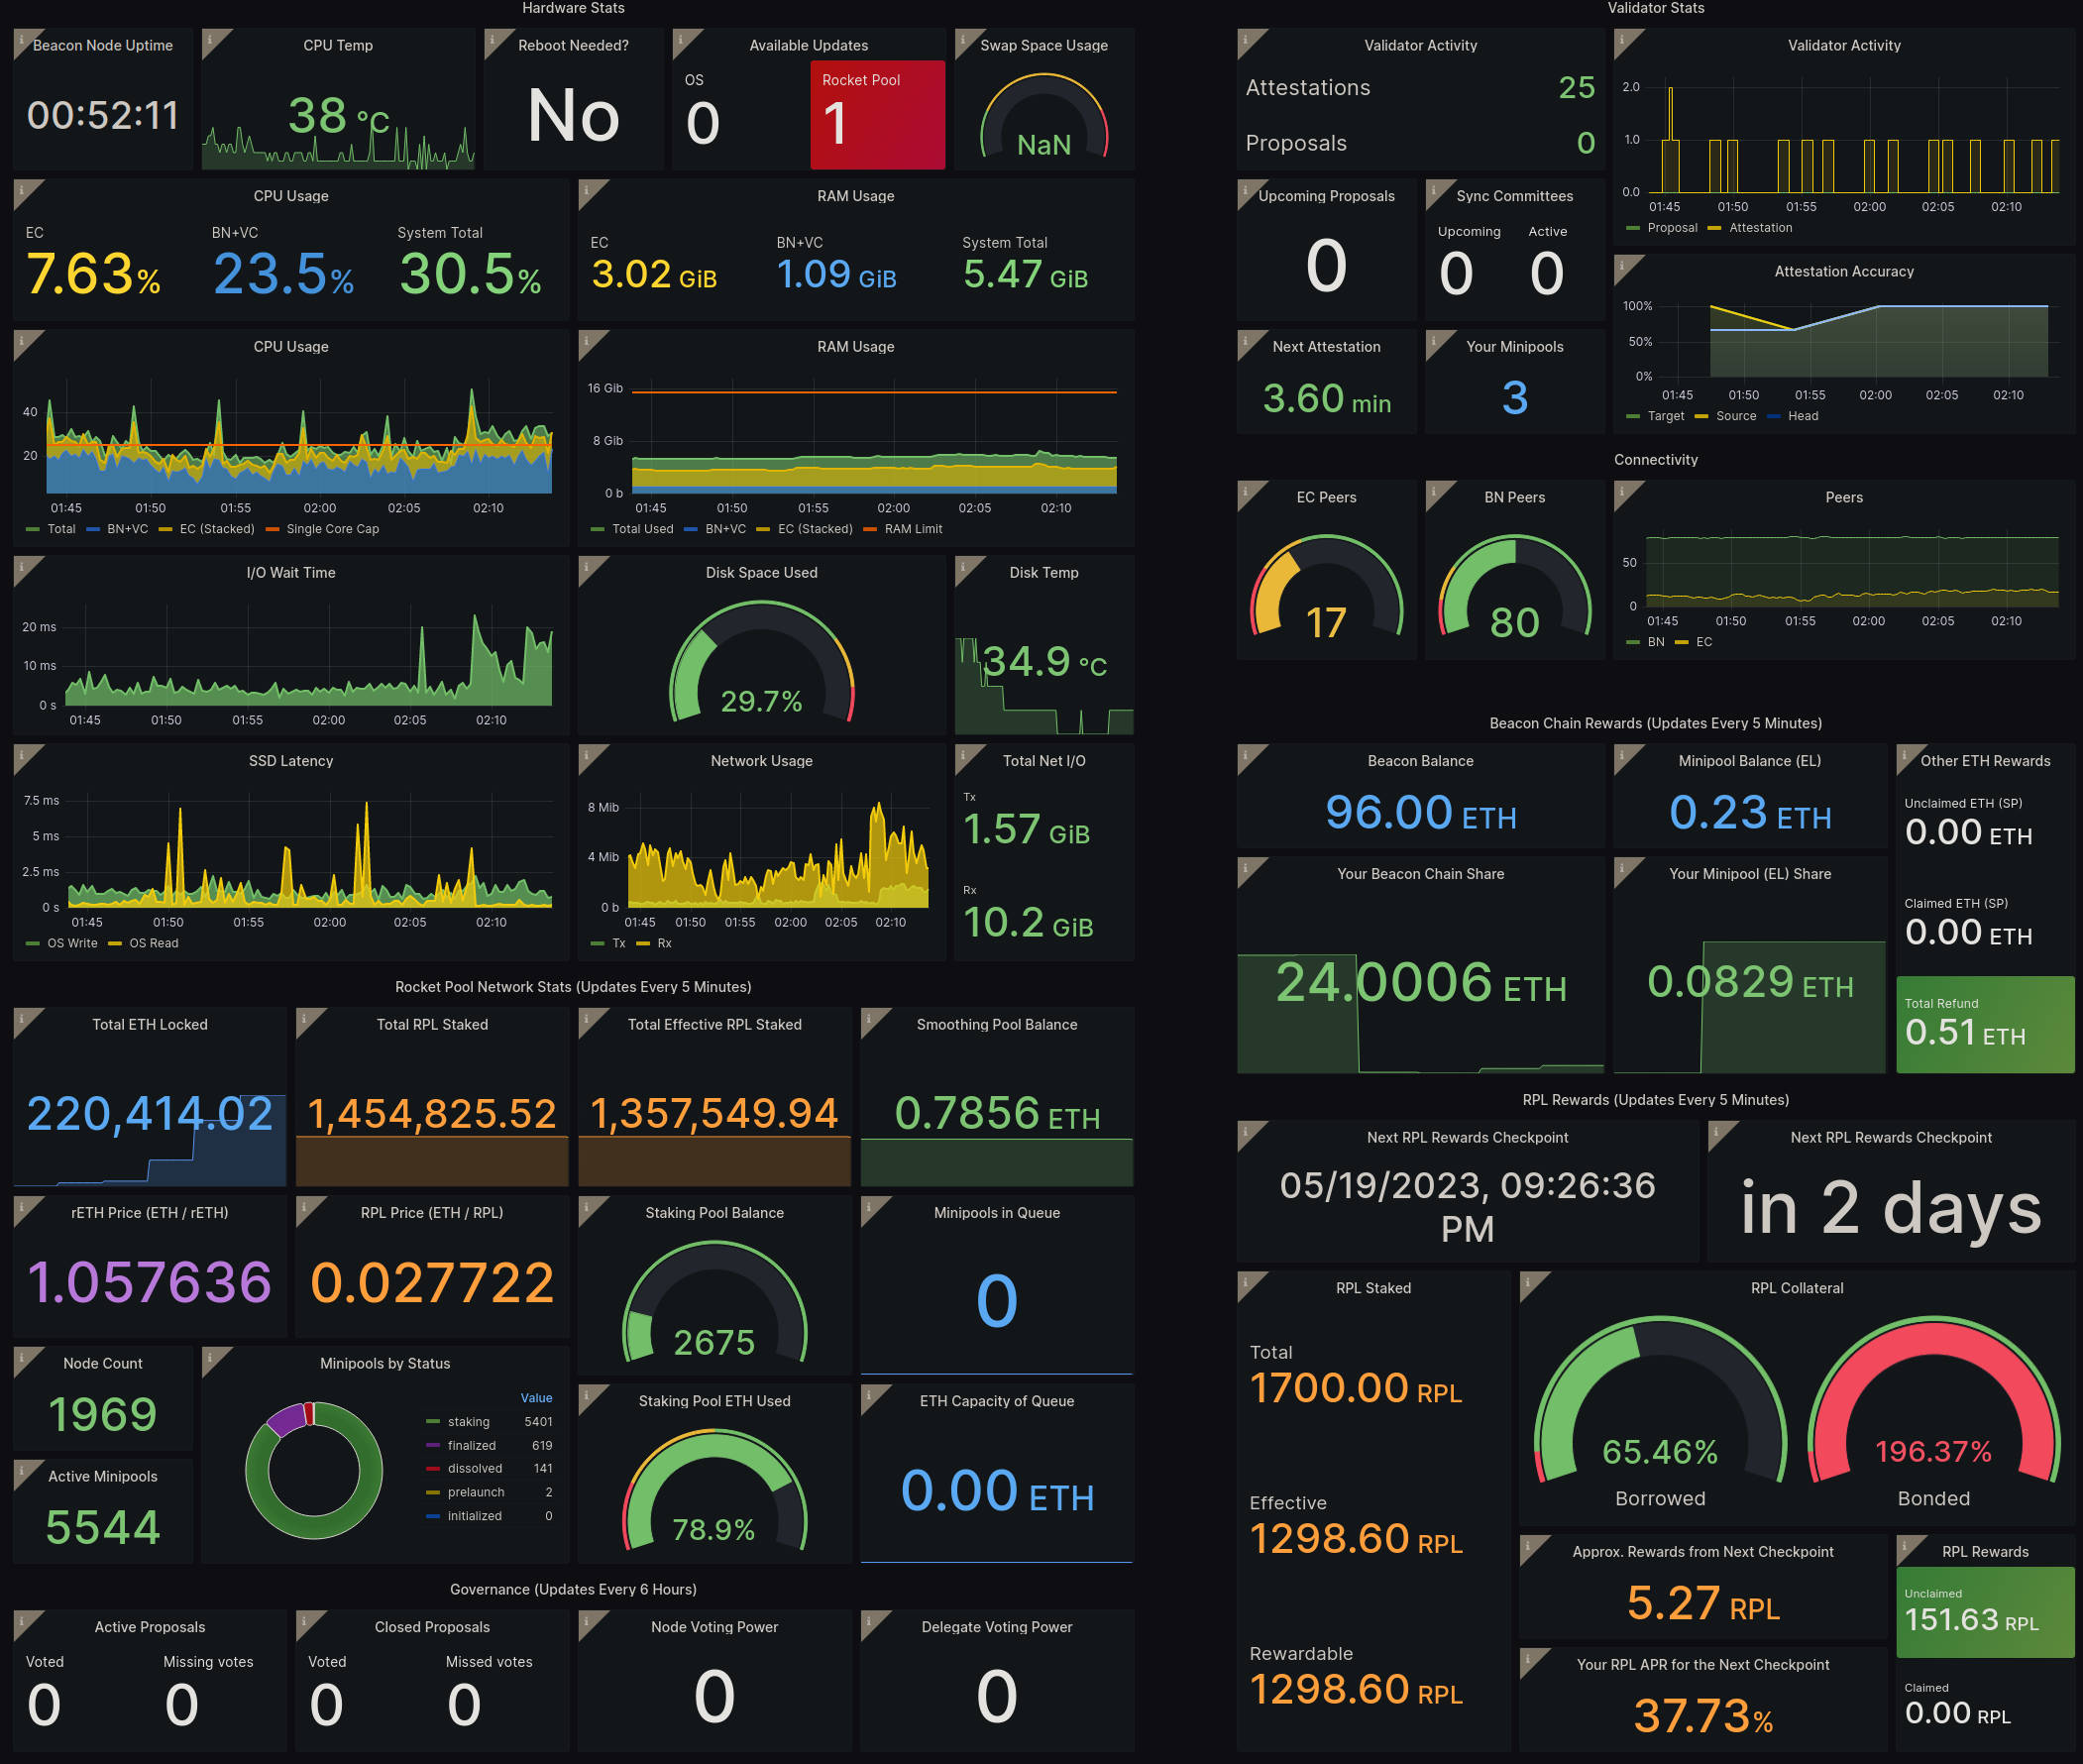
The standard dashboard includes the following information all in a convenient format:
- Top left: some important statistics about your machine's health and performance, and any pending system updates
- Top right: the activity and performance of your validators on the Beacon Chain, along with some Execution and Consensus client stats
- Bottom left: details about the entire Rocket Pool network, for reference
- Bottom right: details about your staking rewards, both ETH and RPL
In this guide, we'll show you how to enable Rocket Pool's metrics system so you can use this dashboard - or even build your own!
Overview of the Rocket Pool Metrics Stack
If you choose to enable metrics during the Smartnode configuration process, your node will add the following processes:
- Prometheus - a data collection, storage, and reporting system that captures all of the metrics you see above (any many more) and stores them, so they can be looked at over time
- The Prometheus Node Exporter - a service that collects information about your machine's health (such as CPU usage, RAM usage, free disk space and swap space, etc.) and reports it to Prometheus
- Grafana, the tool that exposes Prometheus's data through a convenient website hosted on your node
- An optional custom set of scripts that will report any available Operating System updates to Prometheus, so you know if your system needs to be patched
The default configuration will create Docker containers with all of these services that live alongside the rest of the Smartnode's Docker containers. It will open up a port on your node machine for Grafana, so you can access its dashboard from any machine on your local network with a browser.
Enabling the Metrics Server
Enabling metrics in Docker mode is the easiest of all.
Start by running the Smartnode configuration command again:
Go to the Monitoring / Metrics section and check the Enable Metrics checkbox.
For those who prefer to fine-tune their port settings, you may do so here. Note that all of these ports are restricted to Docker's internal network with the exception of the Grafana port - that will be opened on your machine (so you can access it via a browser from other machines, such as your desktop or phone) so you may want to change that if the default port conflicts with something you already have.
Save and exit, and smartnode will start the Prometheus, Node Exporter, and Grafana Docker containers for you.
It will also modify your Consensus and Validator clients so they expose their own metrics to Prometheus.
The Operating System and Rocket Pool update tracker is not installed by default for maximum flexibility, but the process is simple. If you would like to install it so your dashboard shows you how many updates are available for your system, you can do it with this command:
Under the hood, this will install a service that hooks into your Operating System's package manager, periodically checks for updates, and sends that information to Prometheus. This service is different for every Operating System, but it has been confirmed to work on the following:
- Ubuntu 20.04+
- Debian 9 and 10
- CentOS 7 and 8
- Fedora 34
NOTE
Enabling the service automatically is incompatible with SELinux. If your system has SELinux enabled by default (as is the case with CentOS and Fedora), the installation command will get you most of the way there but will also give you instructions on how to finish the process manually at the end.During this check, it will also compare your installed Rocket Pool Smartnode version with the latest release, and inform you if there's a new release available.
If you enabled the update tracker, then the last step is to restart the Node Exporter with the following command:
After that, you should be all set.
Configure firewall to allow connections for monitoring
If you have UFW enabled as referenced in the Securing your Node section, you will need to open a few ports in order to allow local connections between the Prometheus and your Execution/Consensus Clients. Follow the steps below.
Run the following, and replace the ports as needed:
You can then open the firewall to allow external devices access to your Grafana dashboard.
Use this if you want to access Grafana from any machine inside your local network, but deny access everywhere else. This will be the most common use case.
Please check whether your local network uses the 192.168.1.xxx structure first.
You may have to change the command below to match your local network's configuration if it uses a different address structure (e.g. 192.168.99.xxx).
Setting up Grafana
Now that the metrics server is ready, you can access it with any browser on your local network.
Refer to the tabs below for your Smartnode installation mode.
Navigate to the following URL, substituting the variables with your setup as necessary:
For example, if you node's IP was 192.168.1.5 and you used the default Grafana port of 3100, then you would go to this URL in your browser:
You will see a login screen like this:

The default Grafana information is:
You will then be prompted to change the default password for the admin account.
Pick something strong and don't forget it!
If you lose the admin password, you can reset it using the following command on your node:
You will be able to log into Grafana using the default admin credentials once again, and then you will be prompted to change the password for the admin account.
Thanks to community member tedsteen's work, Grafana will automatically connect to your Prometheus instance so it has access to the metrics that it collects. All you need to do is grab the dashboard!
Importing the Rocket Pool Dashboard
Now that you have Grafana attached to Prometheus, you can import the standard dashboard (or build your own using the metrics that it provides, if you are familiar with that process).
Start by going to the Create menu (the plus icon on the right-side bar) and click on Import:

When prompted for the dashboard ID in the Import via grafana.com box, enter 21863 or use the full URL ((https://grafana.com/grafana/dashboards/21863) and press the Load button.
You will be prompted with some information about the dashboard here, such as its name and where you'd like to store it (the default General folder is fine unless you use a lot of dashboards and want to organize them).
Under the Prometheus drop-down at the bottom, you should only have a single option labeled Prometheus (default). Select this option.
Your screen should look like this:

If yours matches, click the Import button and you will be immediately taken to your new dashboard.
At first glance, you should see lots of information about your node and your validators.
Each box comes with a handy tooltip on the top left corner (the i icon) that you can hover over to learn more about it.
For example, here is the tooltip for the Your Validator Share box:

However, we aren't done setting things up yet - there is still a little more configuration to do.
Some of the boxes (notably the APR ones) have been temporarily disabled due to the way Shapella provides skimmed rewards.
They will be enabled again in a future version of the Smartnode that can track historical rewards properly.
Tailoring the Hardware Monitor to your System
Now that the dashboard is up, you might notice that a few boxes are empty such as SSD Latency and Network Usage. We have to tailor the dashboard to your specific hardware so it knows how to capture these things.
CPU Temp
To update your CPU temperature gauge, click the title of the CPU Temp box and select Edit from the drop down. Your screen will now look something like this:

This is Grafana's edit mode, where you can change what is displayed and how it looks. We're interested in the query box highlighted in red, to the right of the Metrics browser button.
By default, that box has this in it:
There are two fields in this text that are currently blank: chip and sensor.
These are unique to each machine, so you'll have to fill them in based on what your machine provides.
To do this, follow these steps:
- Remove the
, sensor=""portion so it ends withchip=""}. For clarity, the whole thing should now benode_hwmon_temp_celsius{job="node", chip=""}. - Put your cursor in-between the quote marks of
chip=""and pressCtrl+Spacebar. This will bring up an auto-complete box with the available options, which looks like this:

- Select the option that corresponds to your system's CPU.
- Once that's selected, add
, sensor=""back into the string. Place your cursor in-between the quote marks ofsensor=""and pressCtrl+Spacebarto get another auto-complete menu. Select the sensor you want to monitor.
If you don't know which chip or sensor is correct, you'll have to try all of them until you find the one that looks right. To help with this, install the lm-sensors package (for example, sudo apt install lm-sensors on Debian / Ubuntu) and run the sensors -u command to provide what sensors your computer has. You can try to correlate a chip ID from Grafana's list with what you see here based on their names and IDs.
For example, this is one of the outputs of our sensors -u command:
In our case, the corresponding chip in Grafana is pci0000:00_0000:00:18_3 and the corresponding sensor is temp1.
Once you're happy with your selections, click the blue Apply button in the top right corner of the screen to save the settings.
Not all system expose CPU temperature info - notably virtual machines or cloud-based systems.
If yours doesn't have anything in the auto-complete field for chip, this is probably the case and you won't be able to monitor your CPU temperature.
SSD Latency
The SSD Latency chart tracks how long it takes for read/write operations to take. This is helpful in gauging how fast your SSD is, so you know if it becomes a bottleneck if your validator suffers from poor performance. To update the SSD you want to track in the chart, click on the SSD Latency title and select Edit.
This chart has four query fields (four textboxes) with eight device="" portions in total.
You'll need to update the first four of these portions with the device you want to track.
Simply place your cursor in-between the quote marks and press Ctrl+Spacebar to get Grafana's auto-complete list, and select the correct option from there for each of the device="" portions.
You want to start from the leftmost empty setting first, or the auto-complete list may not appear.
If you don't know which device to track, run the following command:
This will output a tree showing your device and partition list, for example:
If you didn't change Docker's default location to a different drive during your Smartnode installation, then the disk you want to track will be the one that your Operating System is installed on.
Look in the MOUNTPOINT column for an entry simply labeled /, then follow that back up to its parent device (the one with disk in the TYPE column).
Typically this will be sda for SATA drives or nvme0n1 for NVMe drives.
If you did change Docker's default location to a different drive, or if you're running a hybrid / native setup, you should be able to use the same technique of "following the mount point" to determine which device your chain data resides on.
Optionally, you can also track latency of a second disk on your system.
This is aimed at people that keep their Operating System and chain data on separate drives.
To set this up, simply follow the instructions above for the last two query fields, substituting device="" portion values with those of the disk you want to track.
Once you're happy with your selections, click the blue Apply button in the top right corner of the screen to save the settings.
Network Usage
This chart tracks how much data you're sending and receiving over a particular network connection. As you might expect, the dashboard needs to know which network you want it to track.
To change it, click on the Network Usage title and select Edit.
This chart has two query fields with two device="" portions in total.
You'll need to update these with the network you want to track.
Place your cursor in-between the quote marks and press Ctrl+Spacebar to get Grafana's auto-complete list, and select the correct option from there for each of the device="" portions.
If you don't know which device to track, run the following command:
The output will look something like this:
Look at the Destination column for the row with the value if default.
Follow that row all the way to the Iface column.
The device listed there is the one you want to use - in this example, eth0.
Once you're happy with your selections, click the blue Apply button in the top right corner of the screen to save the settings.
Total Net I/O
This tracks the total amount of data you've sent and received. You might find it useful to watch if, for example, your ISP limits you to a certain amount of data per month.
The setup is identical to the Network Usage box above, so simply follow those instructions for this box too.
Disk Space Used
This keeps tabs on how full your Operating System disk is getting, so you know when it's time to clean up (and if your chain data lives on the same drive, time to prune Geth or Nethermind).
The steps are the same as the SSD Latency box above, so simply follow those instructions for this box too.
As a reminder, you want the drive that houses the partition which has / in the MOUNTPOINT column for this one because that will be your Operating System drive.
Fill this into the first query field.
Optionally, you can also track the free space of a second disk on your system.
This is aimed at people that keep their Operating System and chain data on separate drives.
Set this up by following the same process, but instead of looking at which partition has / in the MOUNTPOINT column, you want to look for the one that has whatever your second drive's mount point is.
Update the second query field with the disk associated with that partition.
Disk Temp
This tracks the current temperature of your Operating System disk. The steps are the same as the CPU Temp box above, so simply follow those instructions for this box too, substituting CPU chip and sensor values with those of your Operating System disk. Fill these values into the first query field.
Optionally, you can also track the current temperature of a second disk on your system. Set this up by following the same process, substituting the chip and sensor values with those of your second drive. Fill these values into the second query field.
Customizing the Dashboard
While the standard dashboard tries to do a good job capturing everything you'd want to see at a glance, it's quite easy to customize a Grafana dashboard however you want. You can add new graphs, change the way graphs look, move things around, and much more!
Take a look at Grafana's Tutorials page to learn how to play with it and set it up to your liking.
Customizing the Metrics Stack
The tools used in the Rocket Pool Metrics Stack offer a wide array of configuration options beyond what is included in the default Rocket Pool installation. This section includes configuration examples for different use cases.
In general, Grafana configuration options should be passed through using environment variables in override/grafana.yml. Any config option can be converted to an environment variable using the following syntax:
Grafana SMTP Settings for Sending Emails
To send emails from Grafana, e.g. for alerts or to invite other users, SMTP settings need to be configured in the Rocket Pool Metrics Stack. See the Grafana SMTP configuration page for reference.
Open ~/.rocketpool/override/grafana.yml in a text editor.
Add an environment section below the x-rp-comment: Add your customizations below this line line, replacing the values below with those for your SMTP provider.
If using Gmail and 2-Step Verification is enabled, create an App Password for this service.
After making these modifications, run the following to apply the changes:
To test the SMTP settings, go to the Alerting menu and click Contact points.

Click New contact point and select Email as the Contact point type. Enter an email address in the Addresses section and click Test.

Check to see that the test email was received. Click Save contact point* when finished.